Advanced sports analytics for professional handicappers.
Get projections for every game of the season with The Handicapper. Features projections for MLB, NBA, and the NFL.
MLB
NBA
NFL

Sports data for the fans, by the community.

Brought to you by CUE.

Create a projection for every game of the season.
The Handicapper creates projections for every game of the season in five different sports and six different leagues. Each leagues has its own model, which is based on a dynamic modelling framework and a lot of data. In previous versions of The Handicapper it was possible for the user to set model parameters and change lineups. This part is now integrated in the process and the user can just swipe through the projections to find value bets.
Models
The models have also evolved and are now more accurate and even better than before. The biggest change is that for NHL, football (soccer) and NFL to some extent we use team level data instead of a bottom-up approach with player-level data. This way we can model especially defensive ability a lot better. For some of the sports we have several projection models to choose from. 'TheHandicapper' is the default model but there are options for the user who wants to have a different view on a matchup (eg. ‘XgTrend’ for Premier League/Serie A and NHL).
Data
We use various data sources to gather raw player-level game data. This data is fetched to our databases and transformed to match our needs. This process is automated and standardised to ensure that if we need to change something it can be easily done. The transformed data is then presented in the application to help the user in the decision making process.
User Interface
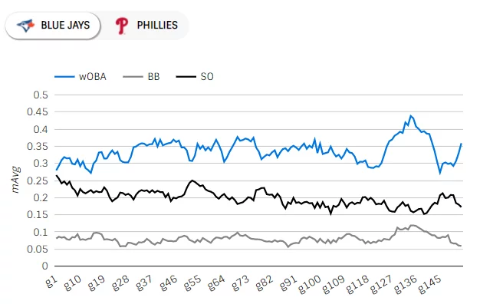
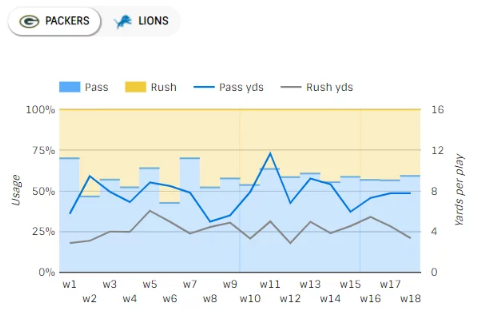
We have tried to put together the most important data and stats in a user friendly interface. The user can rely on the projection but there might be cases where it’s good to have a look for example at how NFL teams have used pass or rush plays lately or for an MLB matchup how the starters average fastball velocity has been lately.